

 2 months ago
96
2 months ago
96
PROTECT YOURSELF with Orgo-Life® QUANTUM TECHNOLOGY
Orgo-Life the new way to the future Advertising by AdpathwayKey Facts
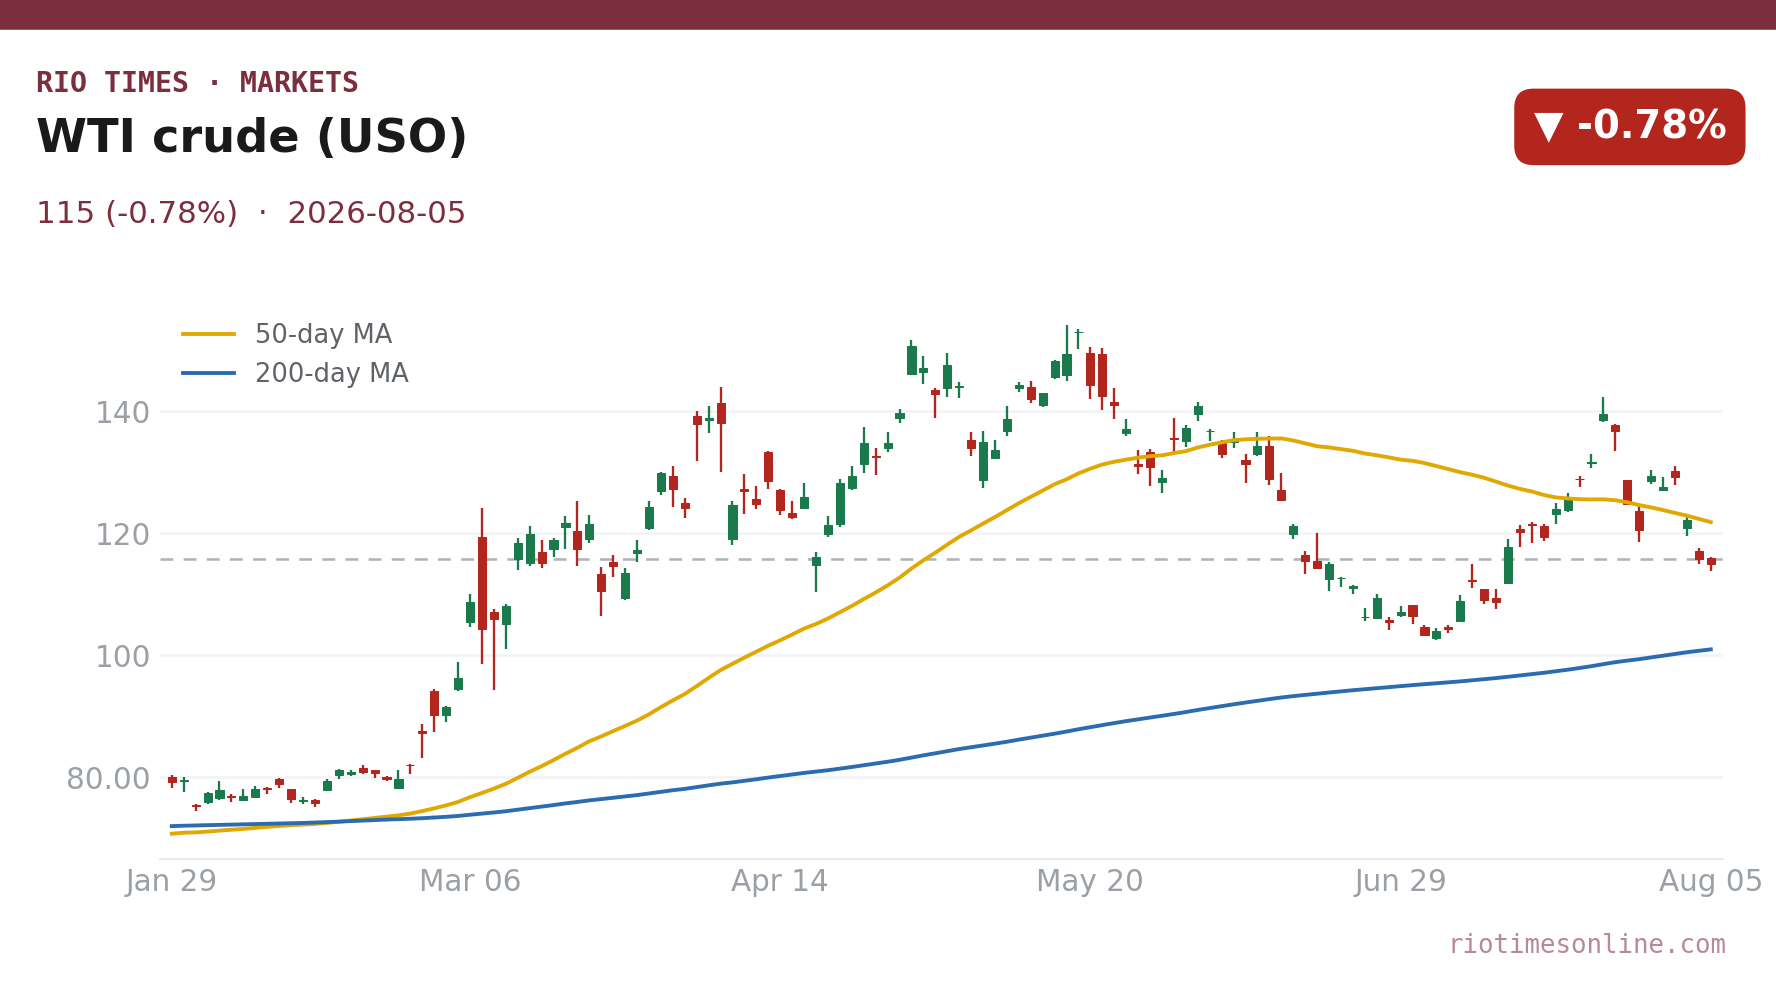
- The WTI-tracking fund USO settled at US$114.88, a daily fall of 0.78% as global benchmark pressures persisted on Wednesday.
- Petrobras shares dropped 1.92% to US$18.36, outpacing the crude decline and signalling specific pressure on Brazil’s state-controlled giant.
- Argentina’s YPF slid 1.95% to US$48.67, making it the weakest proxy on the board despite the geological promise of the Vaca Muerta shale.
- Colombia’s Ecopetrol was the sole gainer, rising 0.49% to US$16.39 and decoupling from the broader regional equity slide.
- Brazil’s macro backdrop tightened further, with the Selic rate at 14.25% and annual inflation running at 4.72% in May, raising capital costs for energy projects.
- The session highlighted a divergence among Latin producers, as mature output declines in Mexico and sanctions on Venezuela contrast with Guyana’s frontier boom and Brazil’s pre-salt export strength.
Today’s Focus
Global crude benchmarks weakened on Wednesday, dragging the USO fund down 0.78% to US$114.88. The move pressured almost every major Latin American oil equity, with YPF and Petrobras falling more steeply than the underlying crude proxy.
Petrobras tumbled 1.92% to US$18.36, a drop that exceeded the WTI decline and reflected both the heavy weight of Brazil’s 14.25% interest rate on capital-intensive pre-salt projects and persistent investor caution around domestic fuel-pricing policy.
Argentina’s YPF suffered the sharpest blow, losing 1.95% to US$48.67 as macro instability and capital controls continued to cloud the investment case for Vaca Muerta. Colombia’s Ecopetrol bucked the trend, rising 0.49% to US$16.39, the only proxy on the board to advance.
The price action underscored a regional split: Guyana’s light-sweet crude boom and Brazil’s pre-salt exports are priced off a Brent benchmark that remains structurally supported, while Pemex’s heavy sour Maya crude and Venezuela’s sanctioned Orinoco Belt barrels represent latent but heavily constrained supply.
What matters today. A single session of crude weakness exposed the sharp divergence between Latin America’s low-cost, Brent-linked export stories and the producers still constrained by local macro and credit risks.

01 The session in one read
Global crude prices softened on Wednesday, August 5, 2026, pulling the United States Oil Fund down 0.78% to US$114.88. USO tracks West Texas Intermediate by holding front-month NYMEX futures, and its retreat signalled a modest but broad bout of selling across oil-linked assets.
The pain was not shared equally. Brazil’s Petrobras slumped 1.92% to US$18.36, Argentina’s YPF dropped 1.95% to US$48.67, and only Colombia’s Ecopetrol swam against the tide, adding 0.49% to close at US$16.39.
Assessment — Crude dip exposes LatAm producer fault lines HIGH
W
e
d
n
e
s
d
a
y
‘
s
.
7
8
%
d
i
p
i
n
t
h
e
W
T
I
p
r
o
x
y
U
S
O
c
a
s
c
a
d
e
d
u
n
e
v
e
n
l
y
a
c
r
o
s
s
L
a
t
i
n
A
m
e
r
i
c
a
n
o
i
l
e
q
u
i
t
i
e
s
,
w
i
t
h
Y
P
F
a
n
d
P
e
t
r
o
b
r
a
s
f
a
l
l
i
n
g
t
w
i
c
e
a
s
f
a
s
t
a
s
c
r
u
d
e
w
h
i
l
e
E
c
o
p
e
t
r
o
l
m
a
n
a
g
e
d
a
g
a
i
n
.
T
h
e
d
i
v
e
r
g
e
n
c
e
c
o
n
f
i
r
m
s
t
h
a
t
i
n
v
e
s
t
o
r
s
a
r
e
d
i
s
c
r
i
m
i
n
a
t
i
n
g
h
e
a
v
i
l
y
b
e
t
w
e
e
n
s
t
o
r
i
e
s
o
f
u
n
e
n
c
u
m
b
e
r
e
d
e
x
p
o
r
t
g
r
o
w
t
h
—
G
u
y
a
n
a
‘
s
S
t
a
b
r
o
e
k
B
l
o
c
k
a
n
d
B
r
a
z
i
l
‘
s
p
r
e
–
s
a
l
t
—
a
n
d
n
a
m
e
s
w
e
i
g
h
e
d
d
o
w
n
b
y
d
o
m
e
s
t
i
c
f
i
s
c
a
l
s
t
r
a
i
n
o
r
s
a
n
c
t
i
o
n
s
.
T
h
e
v
a
r
i
a
b
l
e
t
o
w
a
t
c
h
i
s
t
h
e
p
r
i
c
e
s
p
r
e
a
d
b
e
t
w
e
e
n
B
r
e
n
t
a
n
d
W
T
I
:
a
w
i
d
e
n
i
n
g
g
a
p
w
o
u
l
d
b
e
n
e
f
i
t
B
r
e
n
t
–
l
i
n
k
e
d
A
t
l
a
n
t
i
c
B
a
s
i
n
e
x
p
o
r
t
e
r
s
a
t
t
h
e
d
i
r
e
c
t
e
x
p
e
n
s
e
o
f
P
e
m
e
x
‘
s
U
S
G
u
l
f
s
a
l
e
s
a
n
d
l
i
f
t
t
h
e
r
e
l
a
t
i
v
e
a
p
p
e
a
l
o
f
P
e
t
r
o
b
r
a
s
a
n
d
G
u
y
a
n
a
‘
s
c
o
n
s
o
r
t
i
u
m
.
02 The board
Every major Latin American oil proxy except Ecopetrol closed in the red. YPF posted the steepest decline at 1.95%, a move to US$48.67 that nearly doubled the fall in the crude benchmark itself, underscoring how Argentine macro risk continues to amplify downside moves in the Vaca Muerta developer.
Petrobras shares, trading at US$18.36 after a 1.92% loss, similarly underperformed the WTI proxy. The Brazilian giant’s slide reflected the dual headwind of a high Selic rate at 14.25%—which raises discount rates on long-cycle pre-salt projects—and an inflation print of 4.72% in May that complicates the government’s fuel-price calculus.
| WTI crude (USO) | US$114.88 | -0.78% |
| Petrobras | US$18.36 | -1.92% |
| Ecopetrol | US$16.39 | +0.49% |
| YPF | US$48.67 | -1.95% |
Source: EODHD close, 2026-08-05. Where a commodity has no spot feed, an exchange-traded tracker or leading producer is shown as a labelled proxy.
Live Market IntelligenceThe live market boardInside: market breadth, the sector heatmap, currencies & rates, the Latin America scoreboard and the full instrument board.Rio Times · Live Market Intelligence
Latin America — Cross-Market Board
Regional
Aug 6, 2026 · 06:21
Ibovespa · benchmark
177,726.17 -0.09%
+33.48% over 12 months
Market breadth · 5 names
40% advancing
2 ▲ advancing3 declining ▼
Currencies, rates & key inputs
Latin America scoreboard
IndexLastTodayStrength
IbovespaBrazil 177,726.17 -0.09%
S&P/BMV IPCMexico 66,537.33 -0.47%
S&P IPSAChile 11,157.69 +1.47%
S&P MERVALArgentina 3,156,332 -1.02%
MSCI COLCAPColombia 2,344.80 -1.26%
BVL S&P PerúPeru 58,781.02 +0.81%
Full instrument board
| IBOV | 177,726.17 | -0.09% | +33.48% | 177,894.97 | — | — | — |
| IPSA | 11,157.69 | +1.47% | — | 10,996.46 | 11,179 | 10,996 | 1,513,213,483 |
| IPC MEX | 66,537.33 | -0.47% | +16.56% | 66,848.35 | — | — | — |
| MERVAL | 3,156,332 | -1.02% | +34.49% | 3,188,971 | — | — | — |
| COLCAP | 2,344.80 | -1.26% | — | 9.04 | 9.05 | 9.02 | 4,133 |
| BVL PERÚ | 58,781.02 | +0.81% | — | — | — | — | — |
| USD/BRL | 5.12 | +0.05% | -6.90% | 5.12 | 5.13 | 5.12 | — |
| EUR/BRL | 5.91 | -0.24% | -7.10% | 5.93 | 5.92 | 5.91 | — |
| USD/MXN | 17.25 | +0.12% | -7.93% | 17.23 | 17.27 | 17.21 | — |
| USD/CLP | 913.25 | +0.25% | -5.49% | 911.00 | 913.25 | 913.25 | — |
| USD/COP | 3,174 | -1.04% | -22.36% | 3,207 | 3,176 | 3,173 | — |
| USD/PEN | 3.38 | -0.27% | -4.95% | 3.39 | 3.39 | 3.38 | — |
| USD/ARS | 1,496 | -0.02% | +11.71% | 1,496 | 1,496 | 1,496 | — |
| USD/UYU | 40.26 | +1.28% | +1.57% | 39.75 | 40.26 | 40.26 | — |
| USD/PYG | 5,932 | +1.44% | -19.63% | 5,848 | 5,932 | 5,932 | — |
| USD/BOB | 12.02 | +0.44% | +78.37% | 11.97 | 12.02 | 12.02 | — |
| USD/DOP | 58.08 | -0.38% | -4.08% | 58.30 | 58.09 | 58.08 | — |
| USD/CRC | 448.18 | +1.60% | -9.15% | 441.14 | 448.18 | 448.18 | — |
Largest moves today
USD/CRC 448.18 +1.60%
IPSA 11,157.69 +1.47%
USD/PYG 5,932 +1.44%
USD/UYU 40.26 +1.28%
COLCAP 2,344.80 -1.26%
USD/COP 3,174 -1.04%
MERVAL 3,156,332 -1.02%
BVL PERÚ 58,781.02 +0.81%
The session read
The Ibovespa eased 0.09%, with breadth negative — 2 of 5 names higher. IPSA led, while COLCAP lagged.
P
◆ Live Company Intelligence
Petroleo Brasileiro Petrobras
NYSE: PBRPETR4EnergyOil & Gas Integrated43,199 employees
$120.64B
Market cap
Analyst target $22.22
Wall Street view
4.4Buy/ 5
11 Buy3 Hold0 Sell
Avg. price target $22.22 · +36% vs 200-day
Valuation & profitability
Market cap$120.64B
Revenue (TTM)$498.09B
P / E ratio6.0
Profit margin21.6%
Return on equity25.6%
Price & risk
52-wk low
$10.9752-wk high
$22.07
Beta (volatility)-0.22
200-day average$16.29
Revenue trend · 6y
20202025
Latest $88.10B
Ownership
Institutions21.8%
Shares outstanding3.72B
Top holderGQG Partners LLC
Institutional holders5+ funds
Dividend
Yield15.7%
Payout ratio37.0%
Fwd. annual$1.76
What Petroleo Brasileiro Petrobras does. Petróleo Brasileiro S.A. – Petrobras explores, produces, and sells oil and gas in Brazil, China, the United States, the Americas, Asia, Europe, Singapore, and internationally. It operates through three segments: Exploration and Production; Refining, Transportation & Marketing; and Gas & Low Carbon Energies. The Exploration and Production segment explores, develops, and produces…
03 What moved it
The WTI proxy USO slipped to US$114.88 as traders weighed the effect of a still-tight Brazilian monetary backdrop on global demand assumptions. Brazil’s GDP growth is projected to ease to 1.6% in 2026, down from 3.4% in 2024, and with the Selic at 14.25% after a June cut from 14.50%, financial conditions remain restrictive for commodity consumption across the region’s largest economy.
Brent futures, the pricing anchor for Atlantic Basin crude exports from Brazil, Guyana and Argentina, also faced pressure but held a structural premium to WTI. That spread continued to favour producers that sell cargoes into Europe and Asia—exactly the trade that Petrobras and ExxonMobil’s Stabroek Block consortium have built their export strategies around.
04 The Latin American read
Brazil’s pre-salt remains the region’s most important crude export engine, with Petrobras operating deep-water fields that produce light oil priced against Brent. The Ibovespa index, which includes Petrobras as a heavyweight, has oscillated near the 170,000–175,000 level in recent weeks, with daily swings close to 1% reflecting the market’s sensitivity to oil price moves and local macro data.
Guyana’s offshore boom, led by ExxonMobil, Hess and CNOOC on the Stabroek Block, represents the opposite end of the maturity spectrum from Mexico’s ageing fields. While Pemex continues to export heavy sour Maya crude to the US Gulf under WTI-linked formulas, its gradual production decline and high debt load make it a laggard in the regional growth story.
Argentina’s Vaca Muerta, operated principally by YPF, remains a geologically world-class resource trapped inside a macroeconomically fragile container. Capital controls, an unstable subsidy regime and periodic inflation spikes mean that YPF’s 1.95% drop to US$48.67 often exaggerates moves in the underlying commodity.
Venezuela sits at the far end of the investable spectrum. PDVSA holds some of the planet’s largest reserves in the Orinoco Belt, but sanctions and operational decay have transformed the country from a swing supplier into a latent reserve base that barely registers in visible seaborne trade.
05 The names to watch
Petrobras (US$18.36, -1.92%) is the bellwether. Its pre-salt fields deliver light crude into a Brent-priced market, and its New York-listed ADRs remain the most liquid way for foreign investors to play Brazil’s oil export surge. The 14.25% Selic rate is the silent antagonist, raising the cost of capital for the deep-water drilling that anchors Brazil’s production growth.
YPF (US$48.67, -1.95%) carries the highest beta to local instability among the proxies. Vaca Muerta’s geology is proven, but the firm’s ability to convert rock into revenue depends on a regulatory framework that can shift with Argentine politics.
Ecopetrol (US$16.39, +0.49%) was the outlier. Its gain on a down day for crude suggests a company-specific or local factor at work, possibly related to Colombia’s domestic fuel-price adjustments or a reassessment of its downstream margins.
06 The outlook
The next catalyst for Latin American oil equities will be any movement in the Brent-WTI spread. A widening gap directly advantages Brazil’s pre-salt and Guyana’s Stabroek Block, whose cargoes are priced off Brent, while squeezing Pemex’s WTI-linked export margins more tightly.
Macro data from Brazil remains a near-term swing factor. With inflation at 4.72% and the central bank having only just begun to ease from 14.25%, any hawkish surprise would further raise the discount rate applied to long-duration pre-salt cash flows, potentially deepening Petrobras’ underperformance relative to crude.
07 What to watch
- Brent-WTI spread: A widening spread benefits Brent-linked exporters Petrobras and Guyana’s Stabroek consortium while hurting WTI-linked Pemex sales to the US Gulf.
- Brazil Selic trajectory: The 14.25% policy rate directly affects the discounted value of long-cycle pre-salt projects and will be a key driver of Petrobras ADR performance.
- Argentina regulatory signals: Any shift in capital controls or the Vaca Muerta subsidy regime will move YPF more sharply than crude itself, given the stock’s high beta to domestic policy.
- Guyana production milestones: New well starts or FPSO ramp-ups on the Stabroek Block will reinforce the contrast between frontier growth and the declining output profile of Mexico’s Pemex.
Frequently Asked Questions
Why did Petrobras fall more than crude?
Petrobras dropped 1.92% while the WTI proxy USO fell only 0.78%, reflecting the extra weight of Brazil’s 14.25% interest rate on the valuation of long-cycle pre-salt projects and persistent concern about domestic fuel-pricing intervention.
What is the Brent-WTI spread and why does it matter for Latin America?
The spread is the price difference between North Sea Brent and West Texas Intermediate crude. Brazil’s pre-salt, Guyana’s Stabroek output and Argentina’s Vaca Muerta exports are priced against Brent, so a wider spread raises their revenue relative to WTI-linked Pemex sales.
Why did Ecopetrol rise when everything else fell?
Ecopetrol gained 0.49% to US$16.39, the only positive move on the board. The decoupling suggests a local factor—such as a Colombian domestic fuel-price adjustment or downstream margin improvement—offset the modest crude decline.
How do sanctions affect Venezuela’s role in oil markets?
Sanctions and operational decay have relegated PDVSA from a major exporter to a latent reserve holder. Venezuela’s Orinoco Belt contains some of the world’s largest reserves, but its barrels rarely reach transparent seaborne markets and have minimal day-to-day influence on Brent or WTI pricing.
This article was produced by The Rio Times’ automated newsroom system. How we use AI · Report an error
LatAm Markets: Live Signals → — real-time movers, turnover leaders and FX across Latin America.
The Rio Times · Power Map
See who really holds power in Latin America
Click to open the Power Map →


















 English (US) ·
  French (CA) ·
  French (FR) ·