

 1 week ago
7
1 week ago
7
PROTECT YOURSELF with Orgo-Life® QUANTUM TECHNOLOGY
Orgo-Life the new way to the future Advertising by Adpathway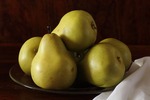 Bartlett Pears
In 2025, worldwide exports of fresh pears attained a total value of US$3 billion.
International sales of pears rose by an average 7.5% since 5 years earlier in 2021 when globally exported pears attracted revenues of $2.79 billion.
Year over year, the total value of pear exports gained 4.7% compared to $2.87 billion for 2024.
Worldwide there are over 3,000 varieties of pears, according to informational portal Northern Nester. Popular varieties include green and red Anjou, Bartlett, russet brown Bosc, round-shaped Asian, and French Butter pears. Many consumers choose Bosc pears as the tastiest, while Anjou and Bartlett pears are among the juiciest.
Like apples, fresh whole pears are typically eaten in bite-size slices. The skin of a pear is edible, albeit some consumers prefer to peel pears before eating them. Pears can also be cooked or dried.
The 5 biggest exporters of pears (mainland China, Netherlands, Belgium, South Africa and Argentina) supplied approaching three-quarters (71.3%) worth of globally exported pears during 2025.
Applying a continental lens, countries in Europe sold the highest dollar worth of exported pears during 2025 via shipments valued at $1.4 billion or 46.2% of the global total. In second place were exporters located in Asia at 26.3%. Smaller percentages originated from sellers in Latin America excluding Mexico (13%) but including the Caribbean, Africa (9.4%), North America (4.7%) then Oceania (0.4%) led by Australia and New Zealand.
Turning to imports, the 5 leading importers of pears in 2025 were Indonesia, Germany, United Kingdom, Italy and the Netherlands. Collectively, that quintet of top buyers bought over a third (35.3% of globally imported pears).
Those percentages suggest a much more concentrated cohort of 100 total of exporters of pears (71.3% for top 5 export suppliers) compared to some 200 importing countries, islands and territories for the 5 biggest importers (35.3%).
From a continental perspective, almost half 49.5% of globally imported pears was delivered to European countries well ahead of importers in Asia (31.2%), North America (9.7%), Latin America (7.4%) excluding Mexico but including the Caribbean, Africa (1.8%), then Oceania (0.3%) mostly buyers in Australia and New Zealand.
Worldwide, the average unit price paid by importers of pears was calculated as $1,269 per ton in 2025. That dollar amount reflects a 0.7% increase compared to the average tonnage rate of $1,260 for 2024.
For research purposes, the 6-digit Harmonized Tariff System code prefix is 081070 for fresh pears.
Top Pears Exports by Country
Below are the top 20 countries that exported the highest dollar value worth of pears during 2025.
- mainland China: US$626.4 million (20.9% of total pears exports)
- Netherlands: $591 million (19.7%)
- Belgium: $362.9 million (12.1%)
- South Africa: $280.6 million (9.3%)
- Argentina: $279.7 million (9.3%)
- United States: $141.8 million (4.7%)
- Chile: $110.2 million (3.7%)
- Spain: $109.7 million (3.7%)
- Portugal: $107.4 million (3.6%)
- Italy: $85.9 million (2.9%)
- Türkiye: $68.8 million (2.3%)
- South Korea: $58.6 million (2%)
- Poland: $48.8 million (1.6%)
- Germany: $17.7 million (0.6%)
- France: $15.9 million (0.5%)
- Greece: $11.6 million (0.4%)
- Japan: $7.6 million (0.3%)
- Lithuania: $7.4 million (0.2%)
- Hong Kong: $6.9 million (0.2%)
- Australia: $6.8 million (0.2%)
- Indonesia: US$370.7 million (11.2% of total imported pears)
- Germany: $285.1 million (8.6%)
- United Kingdom: $171.7 million (5.2%)
- Italy: $168.3 million (5.1%)
- Netherlands: $167.5 million (5.1%)
- Brazil: $158.9 million (4.8%)
- United States: $150.3 million (4.6%)
- Russia: $130.5 million (4%)
- France: $120.3 million (3.6%)
- Vietnam: $118.6 million (3.6%)
- Spain: $94 million (2.9%)
- Mexico: $88.1 million (2.7%)
- Canada: $82.5 million (2.5%)
- Thailand: $59.5 million (1.8%)
- Poland: $59.1 million (1.8%)
- Hong Kong: $54.8 million (1.7%)
- United Arab Emirates: $47.9 million (1.5%)
- Iraq: $47.1 million (1.4%)
- Philippines: $45.8 million (1.4%)
- Belgium: $44 million (1.3%)
- Niger: US$98 per ton (down -5.8% from 2024)
- Burkina Faso: $145 per ton (up 12.4%)
- Mauritania: $173 per ton (down -4.4%)
- Tajikistan: $343 per ton (down -44.7%)
- Laos: $396 per ton (down -52.5%)
- Paraguay: $401 per ton (up 6.1%)
- Lesotho: $433 per ton (up 16.7%)
- Syria: $436 per ton (down -21.3%)
- Mongolia: $459 per ton (down -5%)
- Zambia: $459 per ton (up 8%)
- Eswatini: $461 per ton (up 1.5%)
- Belarus: $468 per ton (down -5.1%)
- Liberia: $471 per ton (down -52.9%)
- North Korea: $481 per ton (down -4.6%)
- Kenya: $481 per ton (up 0.6%)
- Northern Mariana Islands: US$8,000 per ton (2024 data unavailable)
- Turks/Caicos Islands: $5,000 per ton (up 66.7% from 2024)
- Tanzania: $4,721 per ton (up 163.7%)
- South Korea: $4,000 per ton (down -18.4%)
- Iraq: $3,869 per ton (up 216.9%)
- Sao Tome/Principe: $3,556 per ton (up 7.8%)
- St Maarten (Dutch): $3,500 per ton (down -12.5%)
- British Virgin Islands: $3,400 per ton (up 13.3%)
- South Sudan: $3,250 per ton (up 430.2%)
- US Minor Outlying Islands: $3,171 per ton (down -9.6%)
- Marshall Islands: $2,944 per ton (down -6.3%)
- Saint Vincent/Grenadines: $2,750 per ton (up 17.9%)
- Gibraltar: $2,629 per ton (up 31.5%)
- Solomon Islands: $2,462 per ton (2024 data unavailable)
- Saint Lucia: $2,438 per ton (down -0.4%)
By value, the listed 20 countries shipped 98% of globally exported pears in 2025.
Among the top exporters, the fastest-growing pears exporters since 2024 were: Lithuania (up 104.4%), France (up 27.8%), Türkiye (up 19.4%) and Germany (up 19.3%).
Listed suppliers that posted annual declines in their exported pears sales were: Hong Kong (down -41.9%), Belgium (down -7.1%), Poland (down -6.2%), Chile (down -4.4%) and South Korea (down -0.4%).
Top Pears Imports by Country
The overall cost for imported pears recorded a 14% expansion over the 5-year period starting in 2021 and rose by 7.7% year over year since 2024.
Below are the 20 best buying markets as measured by the highest dollar value worth of pears imported during 2025.
By value, the listed 20 countries bought 74.7% of globally imported pears in 2025.
Among the top importers, the fastest-growing pears importers since 2024 were: Vietnam (up 122.7%), Iraq (up 91%), Poland (up 48.4%) and the United Arab Emirates (up 31.9%).
Listed buyer countries that posted annual year-over-year declines in their imported pears sales were led by: Mexico (down -13.9%), Belgium (down -9.8%), Hong Kong (down -9.5%), Thailand (down -8.6%) and Italy (down -3.4%).
Lowest and Highest Unit Prices for Imported Pears
In 2025, the world’s average unit price for imported pears was US$1,269 per ton. That dollar average reflects a 0.7% upturn compared to an average $1,260 per ton one year earlier for 2024 and inflated by 11.1% from $1,142 in 2021.
The average tonnage charge paid by the world’s leading pears importer, Indonesia, was higher at $1,498 for 2025.
Ranked in ascending order, listed below are the countries paying the lowest average unit prices for imported pears in 2025.
Experiencing double-digit reductions in average unit price paid per ton for pears were low-cost importers Liberia (down -52.9% from 2024), Laos (down -52.5%), Tajikistan (down -44.7%) and Syria (down -21.3%).
The following countries paid for imported pears that cost the highest average unit prices.
Enduring the strongest inflation in terms of higher average unit prices paid in 2025 for pears compared to 2024 were importers in South Sudan (up 430.2%), Iraq (up 216.9%), Tanzania (up 163.7%), Turks and Caicos Islands (up 66.7%) then Gibraltar (up 31.5%).
Related Read: Top Apricots Exports & Imports by Country Plus Average Prices
See also Top Cranberries Exports & Imports by Country Plus Average Prices, Top Strawberries Exporters by Country, Top Persimmons Exports & Imports by Country Plus Average Prices, Sweet Cherries Exports by Country and Bananas Exporters Ranked by Average Prices & Shipment Weight
Research Sources:
Alibaba, Pears Showroom. Accessed on October 1, 2026
Central Intelligence Agency, The World Factbook Field Listing: Exports – Commodities. Accessed on October 1, 2026
International Trade Centre, Trade Map. Accessed on October 1, 2026
Northern Nester, 10 Popular And Common Types of Pears – Complete Guide 2025. Accessed on October 1, 2026
Wikipedia, Pear. Accessed on October 1, 2026























 English (US) ·
  French (CA) ·
  French (FR) ·