

 2 months ago
32
2 months ago
32
PROTECT YOURSELF with Orgo-Life® QUANTUM TECHNOLOGY
Orgo-Life the new way to the future Advertising by Adpathway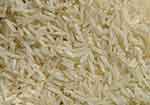 Uncooked white rice
Global demand for imported rice resulted in US$34.6 billion worth of sales in 2025.
The overall value of rice imports from all buyer countries grew by an average 18.2% since 2021 when worldwide rice purchases cost $29.2 billion.
Year over year, globally imported rice declined by -12.2% compared to $39.3 billion in international purchases during 2024.
The top 5 countries for importing rice are the Philippines, Saudi Arabia, United States of America, mainland China and Iraq. Combined, those 5 major rice buyers generated approaching quarter (22.7%) of worldwide demand for imported rice.
Applying a continental lens, Asian countries consumed the highest dollar worth of imported rice during 2025 with purchases valued at $15.4 billion or exceeding two-fifths (44.6%) of the global total. In second place were importers located in Africa at 25.7% while another 14.9% of worldwide rice imports was delivered to buyers in Europe.
Smaller percentages were accepted by importers in North America (7.4%), Latin America (5.6%) excluding Mexico but including the Caribbean, then Oceanian countries (1.6%) led by Australia, Papua New Guinea and New Zealand.
For research purposes, the 4-digit Harmonized Tariff System code prefix for rice is 1006.
Below are the 15 countries that imported the highest dollar value worth of rice during 2025.
- Philippines: US$1.7 billion (5% of total rice imports)
- Saudi Arabia: $1.7 billion (4.9%)
- United States: $1.6 billion (4.7%)
- mainland China: $1.44 billion (4.2%)
- Iraq: $1.36 billion (3.9%)
- Vietnam: $1.22 billion (3.5%)
- Ivory Coast: $1.1 billion (3.2%)
- Benin: $864.2 million (2.5%)
- United Arab Emirates: $783.8 million (2.3%)
- Malaysia: $776.9 million (2.2%)
- Bangladesh: $760.1 million (2.2%)
- Iran: $749.8 million (2.2%)
- France: $728.4 million (2.1%)
- United Kingdom: $681 million (2%)
- Japan: $669.6 million (1.9%)
The top 15 countries purchased almost half (46.8%) of all rice imported during 2025. Imported rice remains in demand from importing geographies located around the globe.
Among the above countries, the fastest-growing markets for rice since 2024 were: Bangladesh (up 671.8%), mainland China (up 56.2%), Benin (up 21.8%) and the United Arab Emirates (up 21.3%).
Those countries that posted year-over-year declines in their imported rice purchases were led by: Philippines (down -31.9%), Malaysia (down -29.3%), Vietnam (down -19.8%) and Iraq (down -18.4%).
Searchable List of Rice Importing Countries in 2025
The 100 countries showcased in the automated database account for 95.8% of the global spending on imported rice during 2025.
You can change the presentation order by clicking the triangle icon at the top of any of the columns below.
| 1 | Philippines | $1,714,161,000 | -31.9% |
| 2 | Saudi Arabia | $1,689,217,000 | -15.7% |
| 3 | United States | $1,639,031,000 | +1.4% |
| 4 | mainland China | $1,437,707,000 | +56.2% |
| 5 | Iraq | $1,356,615,000 | -18.4% |
| 6 | Vietnam | $1,216,592,000 | -19.8% |
| 7 | Ivory Coast | $1,108,097,000 | +10.2% |
| 8 | Benin | $864,230,000 | +21.8% |
| 9 | United Arab Emirates | $783,814,000 | +21.3% |
| 10 | Malaysia | $776,877,000 | -29.3% |
| 11 | Bangladesh | $760,105,000 | +671.8% |
| 12 | Iran | $749,816,000 | +5.2% |
| 13 | France | $728,385,000 | +6.1% |
| 14 | United Kingdom | $680,951,000 | -10% |
| 15 | Japan | $669,616,000 | +6.8% |
| 16 | Germany | $621,782,000 | +12.5% |
| 17 | Senegal | $579,709,000 | +11.9% |
| 18 | South Africa | $548,057,000 | -15.4% |
| 19 | Yemen | $494,108,000 | +81.1% |
| 20 | Canada | $493,350,000 | +7.3% |
| 21 | Guinea | $488,179,000 | -3.7% |
| 22 | Belgium | $484,855,000 | -23.5% |
| 23 | Niger | $428,935,000 | +52.9% |
| 24 | Kenya | $425,351,000 | -15.7% |
| 25 | Mexico | $420,193,000 | -32% |
| 26 | Netherlands | $397,942,000 | -8.5% |
| 27 | Mozambique | $395,023,000 | -18.6% |
| 28 | Brazil | $390,076,000 | -42.6% |
| 29 | Italy | $356,428,000 | +10.8% |
| 30 | Madagascar | $342,238,000 | +137.6% |
| 31 | Singapore | $336,684,000 | -1.4% |
| 32 | Haiti | $311,097,000 | -15.6% |
| 33 | Cameroon | $298,396,000 | -43.2% |
| 34 | Nepal | $295,812,000 | +71.9% |
| 35 | Oman | $294,336,000 | -3.1% |
| 36 | Türkiye | $293,133,000 | +4.3% |
| 37 | Spain | $291,314,000 | -9% |
| 38 | Somalia | $283,046,000 | -4.9% |
| 39 | South Korea | $275,191,000 | -32.9% |
| 40 | Angola | $271,695,000 | -8.1% |
| 41 | Australia | $262,464,000 | -4.3% |
| 42 | Hong Kong | $261,963,000 | +4.8% |
| 43 | Liberia | $257,570,000 | +25.5% |
| 44 | Uganda | $219,785,000 | -4.2% |
| 45 | Indonesia | $217,668,000 | -92% |
| 46 | Portugal | $197,470,000 | +18.8% |
| 47 | Kuwait | $194,078,000 | -35.6% |
| 48 | Afghanistan | $188,340,000 | -52.1% |
| 49 | Cuba | $180,198,000 | +73.6% |
| 50 | Poland | $177,295,000 | +2.9% |
| 51 | Jordan | $169,419,000 | -40.4% |
| 52 | Israel | $167,745,000 | +5.5% |
| 53 | Rwanda | $163,037,000 | -27.7% |
| 54 | Zimbabwe | $161,473,000 | -15% |
| 55 | Papua New Guinea | $159,693,000 | -31.2% |
| 56 | Djibouti | $158,686,000 | -6.3% |
| 57 | Burkina Faso | $150,540,000 | +9.8% |
| 58 | Sierra Leone | $148,217,000 | -37.5% |
| 59 | Costa Rica | $137,379,000 | -23.4% |
| 60 | Algeria | $135,158,000 | -29.9% |
| 61 | Qatar | $131,767,000 | -34.7% |
| 62 | Egypt | $129,907,000 | +27.8% |
| 63 | Czech Republic | $123,704,000 | +12.6% |
| 64 | Chile | $120,320,000 | -16.7% |
| 65 | Sweden | $115,710,000 | +6.7% |
| 66 | Switzerland | $114,113,000 | +11.9% |
| 67 | Peru | $111,438,000 | -10.2% |
| 68 | Russia | $111,185,000 | -14.9% |
| 69 | Syria | $110,869,000 | -18.7% |
| 70 | Libya | $108,003,000 | +46.6% |
| 71 | Gambia | $106,494,000 | +51.8% |
| 72 | Sri Lanka | $101,674,000 | +18.9% |
| 73 | Ghana | $100,460,000 | -55.4% |
| 74 | Guinea-Bissau | $99,159,000 | +27.4% |
| 75 | Togo | $98,672,000 | +28.4% |
| 76 | Nicaragua | $97,651,000 | -15.9% |
| 77 | El Salvador | $97,594,000 | +58.2% |
| 78 | Morocco | $96,414,000 | +28.5% |
| 79 | Chinese Taipei | $94,597,000 | -6% |
| 80 | Venezuela | $88,659,000 | -41.8% |
| 81 | Honduras | $83,505,000 | -27% |
| 82 | Democratic Republic Congo | $80,833,000 | +21.1% |
| 83 | Austria | $79,771,000 | +9.9% |
| 84 | Mauritius | $75,907,000 | +6.1% |
| 85 | Romania | $67,143,000 | +31.4% |
| 86 | Guatemala | $65,436,000 | -29.7% |
| 87 | New Zealand | $65,412,000 | -7.6% |
| 88 | Denmark | $64,482,000 | +3.7% |
| 89 | Ireland | $63,817,000 | +11.4% |
| 90 | Bahrain | $63,439,000 | -18.2% |
| 91 | Jamaica | $62,903,000 | -9.4% |
| 92 | Sudan | $61,174,000 | -21.2% |
| 93 | Nigeria | $58,666,000 | +66.1% |
| 94 | Pakistan | $58,039,000 | +1.3% |
| 95 | Congo | $53,978,000 | -23.4% |
| 96 | Gabon | $52,422,000 | +55.2% |
| 97 | Colombia | $51,776,000 | -63.7% |
| 98 | Finland | $50,579,000 | +4.9% |
| 99 | Norway | $50,504,000 | +12.7% |
| 100 | Azerbaijan | $50,125,000 | -24.2% |
After expanding the scope of our analysis to the top 100 rice importers, there were 71 gainers from 2024 to 2025.
Increasing their spending on imported rice the most were Bangladesh (up 671.8% since 2024), Madagascar (up 137.6%), Yemen (up 81.1%), Cuba (up 73.6%) and Nepal (up 71.9%).
The severest year-over-year declines in imported rice purchases belonged to buyers in Indonesia (down -92% from 2024), Colombia (down -63.7%), Ghana (down -55.4%) then Afghanistan (down -52.1%).
Rice Imports into the Philippines
Below are the top suppliers from which the Philippines imported the highest dollar value worth of rice during 2025. Within parenthesis is the percentage change in value for each supplying country compared to 2024.
- Vietnam: US$1.4 billion (down -23.7% from 2024)
- Thailand: $90.5 million (down -72.5%)
- India: $71.2 million (up 45.7%)
- mainland China: $64.2 million (down -0.6%)
- Pakistan: $50.4 million (down -67.6%)
- Myanmar: $49 million (down -52.6%)
- South Korea: $3.6 million (down -1.1%)
- Bangladesh: $1.6 million (up 45.5%)
- Cambodia: $1.1 million (down -37%)
- Singapore: $227,000 (2024 data unavailable)
- Colombia: $212,000 (2024 data unavailable)
- Japan: $41,000 (down -87.1%)
- Italy: $23,000 (down -17.9%)
- France: $3,000 (2024 data unavailable)
- United States: $1,000 (2024 data unavailable)
By value, the listed countries shipped 100% of rice imported by the Philippines in 2025.
Among the above countries, the growth suppliers of rice to Philippines since 2024 were India (up 45.7%) and Bangladesh (up 45.5%).
Countries that experienced year-over-year declines in the value of their rice supplied to Filipino importers included: Japan (down -87.1%), Thailand (down -72.5%), Pakistan (down -67.6%) and Myanmar (down -52.6%).
Overall, the value of Philippines’s rice imports declined by an average -31.9% from all supplying countries since 2024 when rice purchases were valued at $2.5 billion.
Rice Imports into Saudi Arabia
Below are the top suppliers from which Saudi Arabia imported the highest dollar value worth of rice during 2025. Within parenthesis is the percentage change in value garnered by each supplying country compared to 2024.
- India: US$1.3 billion (down -16.5% from 2024)
- Pakistan: $163.1 million (down -27.4%)
- United States: $154.5 million (up 12.5%)
- Australia: $36.9 million (down -32.4%)
- Thailand: $27.2 million (up 12.4%)
- Vietnam: $26.3 million (down -12.3%)
- Brazil: $5.8 million (up 2%)
- Cambodia: $4.9 million (down -31.6%)
- Egypt: $3.5 million (up 140.7%)
- Bangladesh: $1.9 million (up 6.4%)
- Italy: $1.7 million (up 70.7%)
- mainland China: $1.5 million (down -52.1%)
- Argentina: $1.3 million (down -11.1%)
- Portugal: $817,000 (down -68.5%)
- Myanmar: $567,000 (up 6.2%)
The listed countries shipped 99.9% of all Saudi rice imports for 2025.
Among the above countries, the fastest-growing suppliers of rice to Saudi Arabian since 2024 were: Egypt (up 140.7%), Italy (up 70.7%), United States of America (up 12.5%) and Thailand (up 12.4%).
Countries that experienced year-over-year declines in the value of their rice supplied to Saudi importers included: Portugal (down -68.5%), mainland China (down -52.1%), Australia (down -32.4%) and Cambodia (down -31.6%).
Overall, the value of Saudi Arabian’s rice imports slowed by an average -15.7% from all supplying countries since 2024 when rice purchases were valued at $2 billion.
Rice Imports into the United States
Below are the top suppliers from which the United States of America imported the highest dollar value worth of rice during 2025. Within parenthesis is the percentage change in value for each supplying country compared to 2024.
- Thailand: US$965.7 million (up 9.3% from 2024)
- India: $400.9 million (down -5.1%)
- Pakistan: $50.2 million (down -11.6%)
- Argentina: $38.2 million (up 42.2%)
- Vietnam: $31.5 million (up 0.1%)
- mainland China: $29.5 million (down -48.1%)
- Japan: $22.5 million (up 23.9%)
- Canada: $22.4 million (down -16%)
- Italy: $20.3 million (up 9.5%)
- Brazil: $15 million (down -30.4%)
- Mexico: $6.7 million (down -44.7%)
- Cambodia: $5.8 million (up 31.3%)
- Spain: $5.7 million (down -43.2%)
- South Korea: $5.1 million (down -13%)
- Bangladesh: $3.2 million (up 104.2%)
By value, the listed 15 countries shipped 99% of American rice imports in 2025.
Among the above countries, the fastest-growing suppliers of rice to the United States since 2024 were: Bangladesh (up 104.2%), Argentina (up 42.2%), Cambodia (up 31.3%) and Japan (up 23.9%).
Countries that experienced year-over-year declines in the value of their rice supplied to American importers included: mainland China (down -48.1%), Mexico (down -44.7%), Spain (down -43.2%) and Brazil (down -30.4%).
Overall, the value of America’s rice imports went up by an average 1.4% from all supplying countries since 2024 when rice purchases were valued at $1.6 billion.
Rice Imports into China
Below are the top suppliers from which mainland China imported the highest dollar value worth of rice during 2025. Within parenthesis is the percentage change in value for each supplying country compared to 2024.
- India: US$114 million (up 279.6% from 2024)
- Vietnam: $362.9 million (up 119.7%)
- Cambodia: $119 million (up 85.6%)
- Italy: $276,000 (up 59.5%)
- Myanmar: $400.5 million (up 49.8%)
- Thailand: $358.9 million (up 21.8%)
- South Korea: $400,000 (up 21.6%)
- Pakistan: $62.3 million (down -15.5%)
- Laos: $19.1 million (down -22.4%)
- Japan: $297,000 (down -47%)
By value, the listed countries shipped 100% of all Chinese rice imports during 2025.
Among the above countries, the fastest-growing suppliers of rice to mainland China since 2024 were: India (up 279.6%), Vietnam (up 119.7%), Cambodia (up 85.6%) and Italy (up 59.5%).
The trio of year-over-year decliners were Japan (down -47%), Laos (down -22.4%) and Pakistan (down -15.5%).
Overall, the value of China’s rice imports accelerated by an average 56.2% from all supplying countries since 2024 when rice purchases were valued at $920.7 million.
See also Rice Exports by Country, China’s Rice Imports by Country, Saudi Arabia’s Top 10 Imports, Average Rice Prices Compared for Major Rice Export Countries, Best Tofu Exports by Sales, Average Unit Prices & Weight
Research Sources:
Central Intelligence Agency, The World Factbook Field Listing: Imports – Commodities. Accessed on July 6, 2026
International Trade Centre, Trade Map. Accessed on July 6, 2026
Investopedia, Net Exports Definition. Accessed on July 6, 2026





















 English (US) ·
  French (CA) ·
  French (FR) ·