
 4 weeks ago
10
4 weeks ago
10
PROTECT YOUR DNA WITH QUANTUM TECHNOLOGY
Orgo-Life the new way to the future Advertising by AdpathwayThe United States Department of Agriculture (USDA) released its June 2025 World Agricultural Supply and Demand Estimates, confirming that the U.S. will maintain high production levels for corn, soybeans, and wheat in the 2025/26 season.
The USDA projects U.S. corn output at 15.82 billion bushels, the highest ever, driven by increased acreage and stable yields. Soybean production remains steady at 4.34 billion bushels, while wheat output stands at 1.921 billion bushels, slightly down from last year due to reduced harvested area.
The report shows U.S. ending stocks for corn at 1.75 billion bushels, down from last month’s estimate. Soybean stocks hold at 295 million bushels, and wheat stocks drop to 898 million bushels, a 25 million bushel decrease.
These figures reflect stronger-than-expected export demand, particularly for corn and wheat, as U.S. grain finds buyers amid global supply uncertainties. Globally, the USDA forecasts wheat production at 808.6 million metric tons, with consumption outpacing supply.
World wheat ending stocks are set to fall to 262.8 million tons, the lowest in several years. Corn stocks worldwide are also forecast to tighten, dropping to 275.2 million tons.
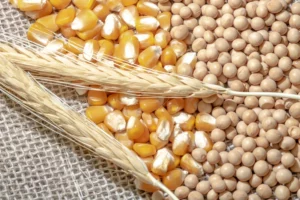 U.S. Grain Output Hits Record Highs as Global Stocks Tighten. (Photo Internet reproduction)
Soybean stocks, however, are projected to rise to a record 125.3 million tons, mainly due to anticipated large crops in South America. The U.S. faces increasing competition from countries like Brazil, Russia, and the European Union.
While U.S. wheat exports are expected to reach a five-year high at 825 million bushels, America’s share of global wheat shipments will likely fall to 10.5%, among the lowest in decades.
The USDA notes that strong early sales, especially of Hard Red Winter wheat, support the higher export forecast, but global buyers have more options than ever. Farm-level prices reflect these supply shifts.
The USDA expects corn to average $4.20 per bushel, soybeans $10.25, and wheat $5.40 in 2025/26. These prices show the impact of abundant supplies but also the risk of tighter stocks if weather or trade conditions change.
This data matters because it shapes food prices, farm incomes, and global trade flows. Tightening stocks for corn and wheat signal less buffer if harvests disappoint or export demand surges.
The figures highlight how U.S. agriculture adapts to shifting global demand and rising competition, with every bushel influencing the world’s food supply.
Key Figures for 2025/26 U.S. Crop Production
| Corn | 15.8 billion bushels (401.8 million tons) | Record high, up ~5% | 1.75–1.8 billion bushels | 95.3 million (up 4.7M) | More acres, higher yields |
| Soybeans | 4.34 billion bushels (118.1 million tons) | Steady, slight increase | 295 million bushels | 83.5 million (down 3.6M) | Fewer acres, better yields |
| Wheat | 1.92 billion bushels (52.3 million tons) | Slightly down | 898–923 million bushels | 45.4–47 million (slight drop) | Declining trend continues |


 English (US) ·
  French (CA) ·
  French (FR) ·