

 2 months ago
44
2 months ago
44
PROTECT YOURSELF with Orgo-Life® QUANTUM TECHNOLOGY
Orgo-Life the new way to the future Advertising by Adpathway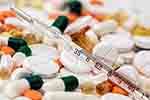 Pharmaceuticals closeup
Worldwide purchases of imported pharmaceutical drugs and medicines cost a total US$594.1 billion in 2025.
Overall spending on pharmaceutical drugs and medicine imports increased by an average 28.2% for all importer countries since 2021 when import purchases of drugs and medicines were valued at $463.2 billion.
Year over year, international purchases of exported drugs and medicines accelerated by 10.9% compared to $535.6 billion in 2024.
The world’s 5 biggest importers of pharmaceutical medicines are the United States of America, Switzerland, Germany, Belgium and France. Collectively, that leading cohort of international buyers paid for 44% of globally imported drugs and medicines during 2025. That percentage indicates a relatively concentrated market of buyers worldwide.
From a continental perspective, European countries were responsible for well over half (57.9%) of spending on drugs and medicines imported during 2025 with pharmaceutical purchases valued at $343.8 billion. In second place were importers located in North America at 19.5% while another 15% of imported pharmaceuticals was delivered to customers in Asia.
Smaller percentages were delivered to Latin America (3.9%) excluding Mexico but including the Caribbean, Africa (2.3%), then Oceania (1.4%) led by Australia and New Zealand.
The metrics below combine subtotals for two 4-digit Harmonized Tariff System code prefixes for drugs and medicine subcategories, specifically prefixes 3003 (consisting of 2 or more constituents mixed together) and 3004 (other).
Drugs and Medicines: Top 15 Importer Countries
Below are the 15 countries that imported the highest dollar value worth of drugs and medicines during 2025.
- United States: US$96.6 billion (16.3% of imported prescription drugs and medicines)
- Switzerland: $55.7 billion (9.4%)
- Germany: $43.7 billion (7.4%)
- Belgium: $41.6 billion (7%)
- France: $23.8 billion (4%)
- mainland China: $23.6 billion (4%)
- Italy: $21.7 billion (3.6%)
- United Kingdom: $20.5 billion (3.5%)
- Spain: $20.1 billion (3.4%)
- Japan: $15.7 billion (2.6%)
- Ireland: $15.1 billion (2.5%)
- Netherlands: $11.9 billion (2%)
- Canada: $11.1 billion (1.9%)
- Slovenia: $10.2 billion (1.7%)
- Poland: $9.6 billion (1.6%)
By value, the listed 15 countries purchased 70.8% of all prescription drugs and medicines imports in 2025.
Among the above countries, the fastest-growing markets for prescription drugs and medicines since 2021 were: Ireland (up 186%), Switzerland (up 106.1%), Slovenia (up 80.1%) and Poland (up 65%).
Those countries that posted year-over-year declines in their imported prescription drugs and medicines purchases were: Japan (down -15.7%), Netherlands (down -11.4%) and mainland China (down -1.2%).
Drugs and Medicines: All Importer Countries in 2025
By value, the 100 key countries showcased in the following automated database bought 98.2% of imported pharmaceutical drugs and medicines purchased in 2025.
| 1 | United States | $96,562,225,000 | +13.3% |
| 2 | Switzerland | $55,718,876,000 | +106.1% |
| 3 | Germany | $43,673,646,000 | +26.9% |
| 4 | Belgium | $41,550,434,000 | +63.5% |
| 5 | France | $23,786,815,000 | +31.5% |
| 6 | mainland China | $23,618,504,000 | -1.2% |
| 7 | Italy | $21,661,587,000 | +23% |
| 8 | United Kingdom | $20,519,342,000 | +37.9% |
| 9 | Spain | $20,110,978,000 | +62.9% |
| 10 | Japan | $15,719,010,000 | -15.7% |
| 11 | Ireland | $15,102,855,000 | +186% |
| 12 | Netherlands | $11,868,056,000 | -11.4% |
| 13 | Canada | $11,138,491,000 | +16.9% |
| 14 | Slovenia | $10,152,885,000 | +80.1% |
| 15 | Poland | $9,617,083,000 | +65% |
| 16 | Russia | $9,351,498,000 | -2.3% |
| 17 | Brazil | $7,522,615,000 | +93.6% |
| 18 | Saudi Arabia | $7,486,934,000 | +68.4% |
| 19 | Australia | $6,888,839,000 | +22% |
| 20 | Czech Republic | $6,265,195,000 | +27.4% |
| 21 | Mexico | $5,799,752,000 | +76.2% |
| 22 | Denmark | $5,736,205,000 | +20.9% |
| 23 | Romania | $5,732,666,000 | +64.4% |
| 24 | Austria | $5,383,026,000 | +23.7% |
| 25 | South Korea | $5,229,813,000 | +8.1% |
| 26 | Sweden | $4,585,857,000 | +40.8% |
| 27 | Taiwan | $4,124,356,000 | +21.3% |
| 28 | Greece | $3,478,598,000 | +29.7% |
| 29 | Portugal | $3,425,231,000 | +39.3% |
| 30 | Hungary | $3,384,135,000 | +12.7% |
| 31 | United Arab Emirates | $3,201,256,000 | -12.9% |
| 32 | Türkiye | $3,126,251,000 | +18.9% |
| 33 | Hong Kong | $2,887,723,000 | +20.8% |
| 34 | Colombia | $2,726,679,000 | +43.2% |
| 35 | Slovakia | $2,519,892,000 | +35.1% |
| 36 | Egypt | $2,510,915,000 | -18.8% |
| 37 | Israel | $2,428,046,000 | +29.1% |
| 38 | Thailand | $2,322,736,000 | +23% |
| 39 | Singapore | $2,187,928,000 | +30.3% |
| 40 | Norway | $2,123,625,000 | +21% |
| 41 | Panama | $2,094,754,000 | +19.7% |
| 42 | Vietnam | $2,051,569,000 | -9.3% |
| 43 | Finland | $1,939,074,000 | +9.5% |
| 44 | Bulgaria | $1,937,109,000 | +23.8% |
| 45 | South Africa | $1,908,642,000 | -5.6% |
| 46 | Kazakhstan | $1,865,272,000 | +68.2% |
| 47 | Philippines | $1,855,811,000 | +30.6% |
| 48 | Serbia | $1,787,906,000 | +64.6% |
| 49 | Lithuania | $1,757,847,000 | +47.5% |
| 50 | Chile | $1,650,251,000 | +23.2% |
| 51 | India | $1,592,857,000 | -13.6% |
| 52 | Ukraine | $1,572,776,000 | -28.3% |
| 53 | Croatia | $1,486,176,000 | +38.6% |
| 54 | Argentina | $1,410,005,000 | +17.2% |
| 55 | Malaysia | $1,286,880,000 | 0% |
| 56 | Latvia | $1,002,325,000 | +41.9% |
| 57 | Guatemala | $977,696,000 | +45.5% |
| 58 | New Zealand | $966,367,000 | +25.9% |
| 59 | Iraq | $945,703,000 | -16.7% |
| 60 | Ecuador | $926,995,000 | +8.5% |
| 61 | Costa Rica | $875,819,000 | +38.5% |
| 62 | Morocco | $855,492,000 | +67.5% |
| 63 | Indonesia | $842,920,000 | -3.7% |
| 64 | Dominican Republic | $835,582,000 | +22.8% |
| 65 | Nigeria | $819,253,000 | -27.7% |
| 66 | Luxembourg | $817,922,000 | +52.6% |
| 67 | Algeria | $797,914,000 | -16.4% |
| 68 | Uzbekistan | $762,132,000 | -36.9% |
| 69 | Peru | $750,761,000 | +7.7% |
| 70 | Kuwait | $730,581,000 | -35.5% |
| 71 | El Salvador | $592,079,000 | +43.2% |
| 72 | Malta | $587,959,000 | +70.9% |
| 73 | Cyprus | $578,452,000 | +65.8% |
| 74 | Oman | $565,826,000 | +43.4% |
| 75 | Belarus | $564,675,000 | -3.4% |
| 76 | Jordan | $551,535,000 | +1.8% |
| 77 | Ivory Coast | $509,767,000 | +25.6% |
| 78 | Georgia | $501,665,000 | +45.7% |
| 79 | Estonia | $501,419,000 | -21.5% |
| 80 | Honduras | $492,392,000 | -11.2% |
| 81 | Nicaragua | $492,349,000 | +25.5% |
| 82 | Iran | $488,783,000 | -42.5% |
| 83 | Sri Lanka | $462,945,000 | +8.1% |
| 84 | Azerbaijan | $457,971,000 | +12% |
| 85 | Bosnia/Herzegovina | $455,529,000 | +38.4% |
| 86 | Kenya | $422,011,000 | -31.6% |
| 87 | Qatar | $406,012,000 | -19.3% |
| 88 | Pakistan | $379,789,000 | -24% |
| 89 | Myanmar | $373,138,000 | -17.6% |
| 90 | Lebanon | $372,465,000 | -26.8% |
| 91 | Senegal | $355,173,000 | +20% |
| 92 | Macao | $353,860,000 | +16% |
| 93 | Zambia | $345,711,000 | +43.9% |
| 94 | Tunisia | $330,922,000 | -21.3% |
| 95 | Tanzania | $322,048,000 | -10.2% |
| 96 | Libya | $320,194,000 | +2.6% |
| 97 | Moldova | $316,276,000 | +13.1% |
| 98 | Uganda | $287,755,000 | 0% |
| 99 | Angola | $287,033,000 | +30.6% |
| 100 | Afghanistan | $281,479,000 | +66.7% |
Widening the scope to focus on the top 100 major importers of drugs and medicines, the fastest-grower over the 5-year period starting in 2021 was Ireland via a 186% increase in spending. In second place were importers in Switzerland (up 106.1%), Brazil (up 93.6%), Slovenia (up 80.1%) and Mexico (up 76.2%).
You can change the above table’s presentation order by clicking the triangle icon at the top of any of the table’s columns.
Drugs and Medicines Companies
Below are conglomerates that are leading suppliers satisfying the global demand for pharmaceuticals. Shown within parenthesis is the country where the supplying business is headquartered.
- Abbott Laboratories (United States)
- AbbVie (United States)
- Actavis (Ireland)
- Allergan (United States)
- AmerisourceBergen (United States)
- Astellas Pharma (Japan)
- AstraZeneca (United Kingdom)
- Bristol-Myers Squibb (United States)
- Cardinal Health (United States)
- Daiichi Sankyo (Japan)
- Eli Lilly & Co (United States)
- GlaxoSmithKline (United Kingdom)
- McKesson (United States)
- Merck & Co (United States)
- Merck (Germany)
- Mylan (United States)
- Novartis (Switzerland)
- Novo Nordisk (Denmark)
- Otsuka Holding (Japan)
- Pfizer (United States)
- Roche Holding (Switzerland)
- Sanofi (France)
- Sinopharm Group (China)
- Takeda Pharmaceutical (Japan)
- Teva Pharmaceutical (Israel)
- Valeant Pharmaceuticals (Canada)
See also Drugs and Medicine Exports by Country, Top Vaccines Exports by Country, Fresh or Frozen Beef Imports by Country and Natural Honey Imports by Country
Research Sources:
Central Intelligence Agency, The World Factbook Field Listing: Imports – Commodities. Accessed on July 7, 2026
International Trade Centre, Trade Map. Accessed on July 7, 2026
Investopedia, Net Exports Definition. Accessed on July 7, 2026
Wikipedia, Drug. Accessed on July 7, 2026




















 English (US) ·
  French (CA) ·
  French (FR) ·